In July, we decommissioned the old traffic statistics on the DE-CIX customer portal. The new traffic insights now available can be found under the "Insights" tab and offer a deeper understanding of your network data.
New insights into your services

Peak and average peering values
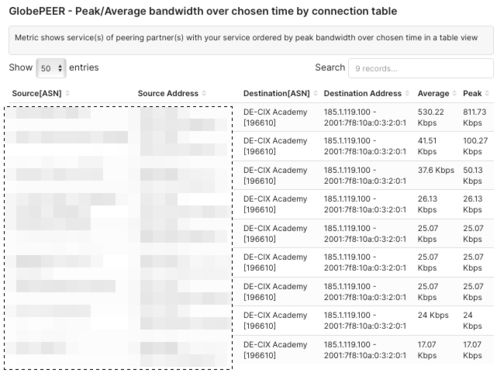
In the portal, under Insights, we now show GlobePEER flow insights. Instead of a traffic volume, it provides average bits per second over the chosen time, and a table with the respective values.
Our Observability team has also added a new peak and average value table showing bandwidth with the networks you peer with over a chosen period of time. This allows you to easily see the bandwidth usage and the need for any adjustments.

Flow data for the Cloud ROUTER
Additionally, we have added a new section to the Insights analytics system for DE-CIX Cloud ROUTER flow data. If you have one or more Cloud ROUTERs there is now a brand new section called “Cloud ROUTER Traffic Insights”. This section contains a dashboard which offers you insights into the traffic flow, including:
- Bandwidth usage over time
- Peak and average bandwidth usage between Autonomous Systems
- Percentage distribution between the service addresses of the top talkers of your Cloud ROUTER(s)
Log into the DE-CIX self-service portal to have a look https://portal.de-cix.net/login.